A C++ Data Stream Processing Parallel Library for Multicores and GPUs
Web Dashboard
Starting from release 2.8.8, WindFlow includes its own web dashboard that can be used to monitor and profile the performance of running WindFlow applications. Once launched, the dashboard starts a REST server on a specific port (8080 by default) of the machine. To avoid performance interference between the dashboard threads and those of the running WindFlow applications, the dashboard can be executed on a separate machine from the ones hosting the applications being monitored.
To use the dashboard, WindFlow applications must be compiled with the WF_TRACING_ENABLED macro. Additional macros are available to specify the hostname and port of the dashboard, since applications assume by default that the dashboard is running on localhost.
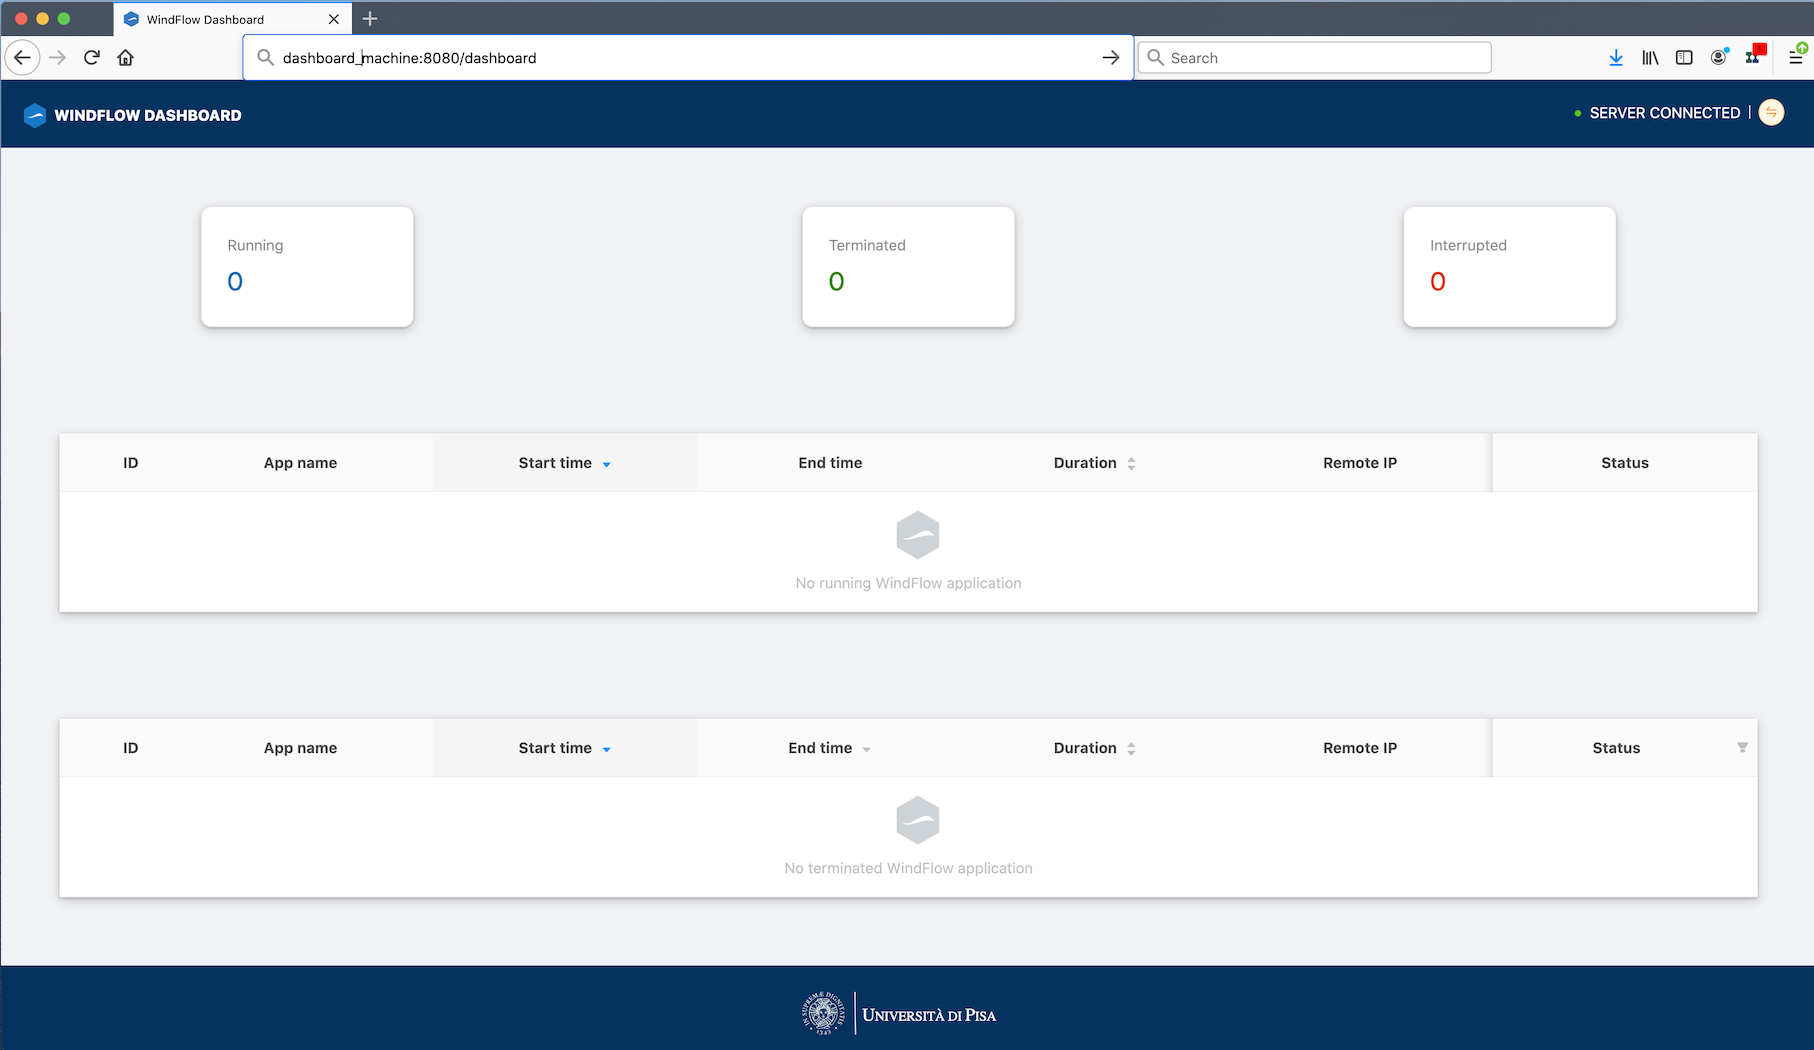
The main web page of the dashboard, which provides a summary of the monitored applications (running, terminated, or interrupted for any reason), is shown alongside. In the figure, the dashboard reports one running application, while no terminated or interrupted applications are listed.
When a WindFlow application is launched, it automatically attempts to connect to the dashboard on the configured port. The WindFlow runtime then spawns an additional monitoring thread that reports statistics to the dashboard every second. Once connected, the monitored application is added to the dashboard’s summary table.


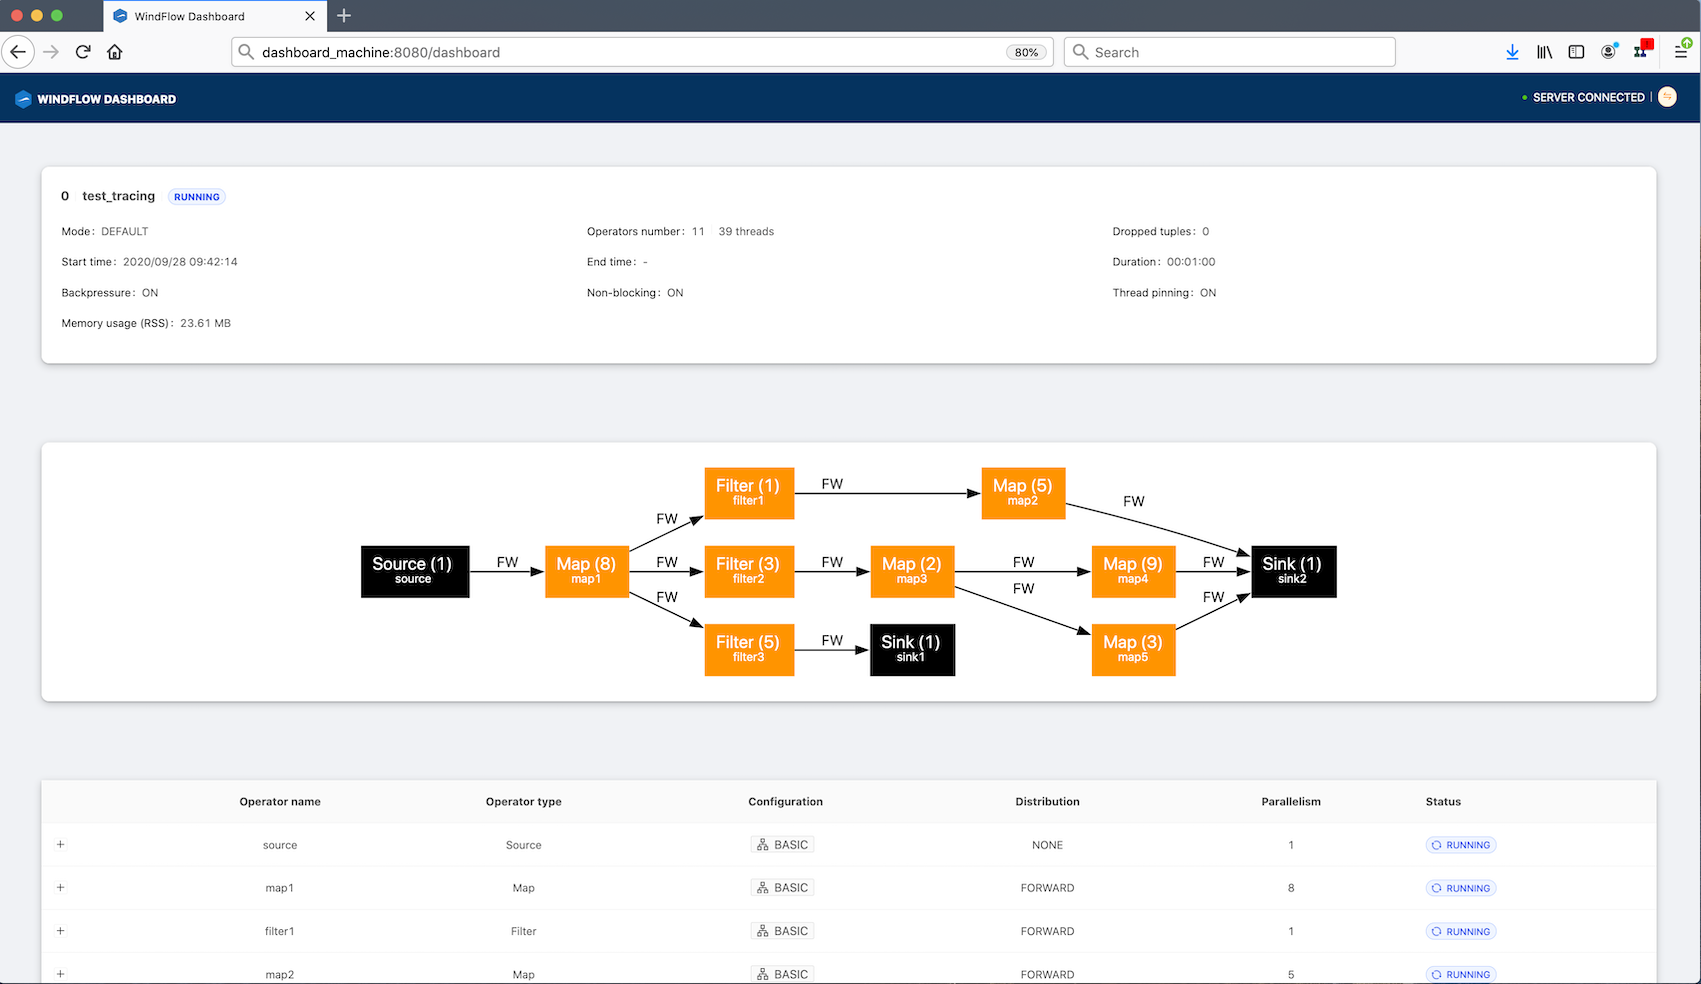
By clicking on the application name, the user is taken to a dedicated web page where the application's statistics can be inspected.
The user can inspect monitoring information for each running operator and for each of its internal replicas. The statistics are updated every second and include metrics such as the number of received and transmitted inputs/outputs, processing time, and more. The figure on the left shows the report page of an application.
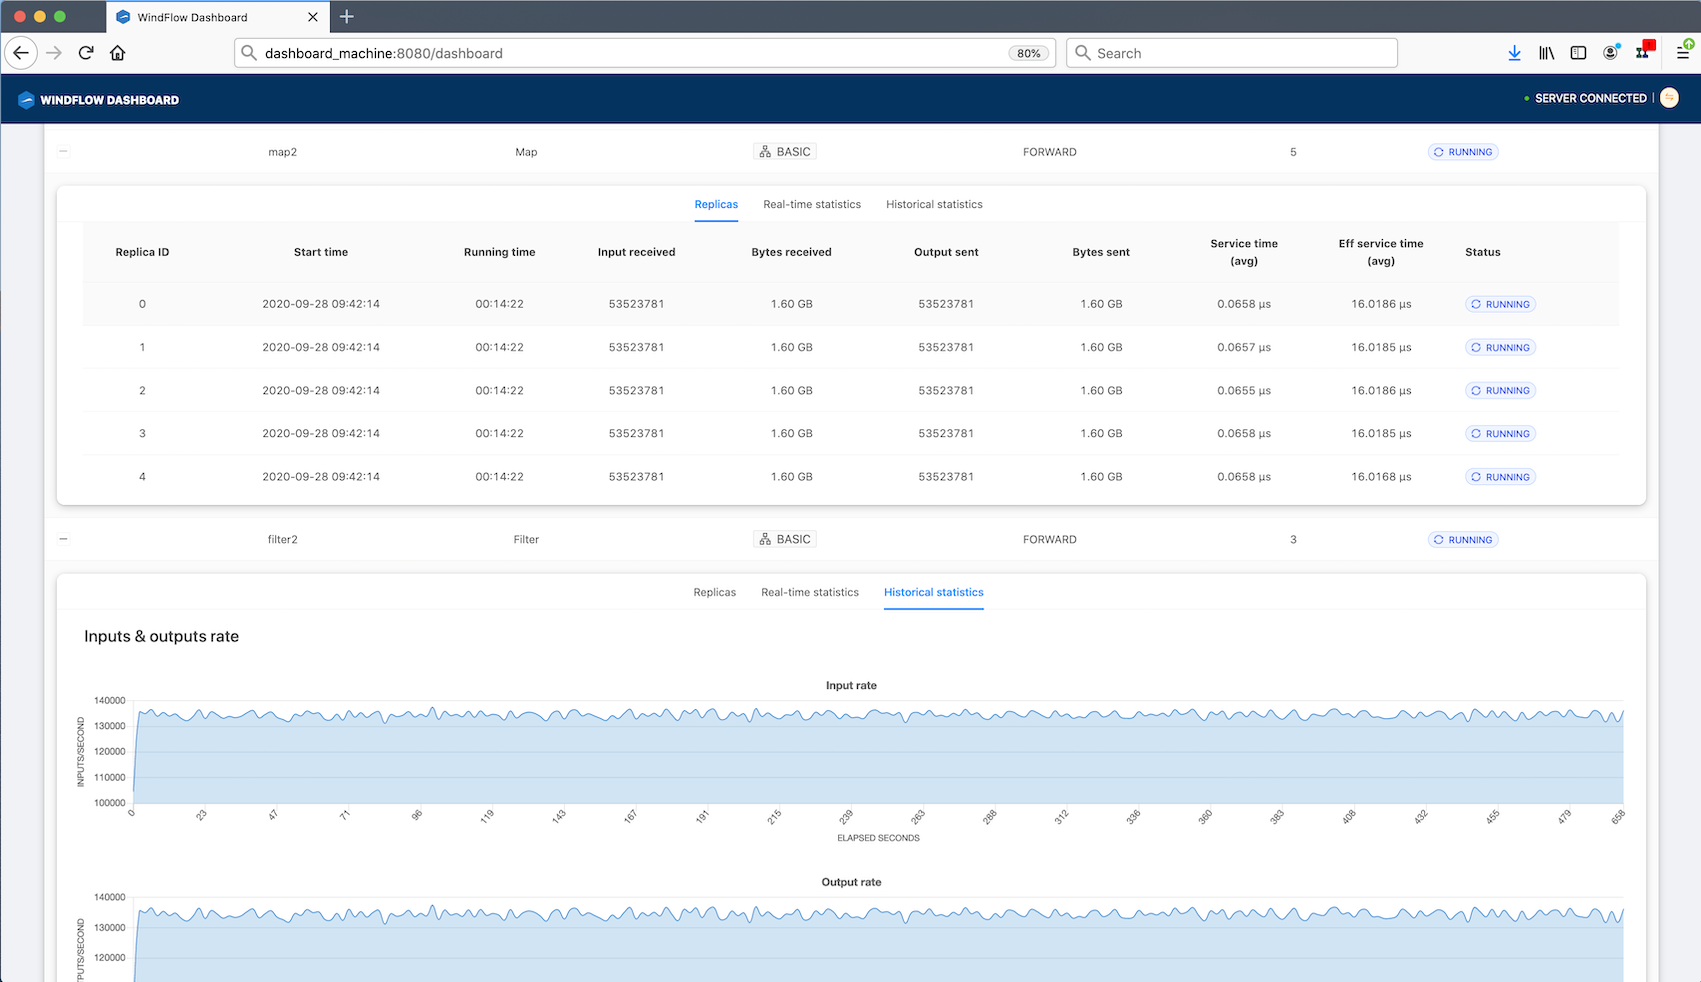
The last screenshot below shows the statistics panel opened for one operator, along with the historical statistics (input and output rate per second over the entire execution) for another operator displayed on the same web page. This feature is useful for continuously tracking application behavior, identifying bottlenecks in the dataflow, and understanding how to further optimize the application as part of the development and configuration process.

The web dashboard is designed to be a helpful tool for developers of WindFlow applications. However, collecting statistics is inherently intrusive and may slow down application performance (we measured a reduction between 5% and 20% in our benchmarks). For this reason, the dashboard should be used with care.